

In this article, I am sharing my deep technical analysis, using the RSI Indicator, you will be able to understand How to know the Reason of BTC Crash using RSI.
This is a weekly chart analysis.
RSI (Relative Strength Index) is an oscillator and leading indicator that signals future price reversals and trend continuations.
Some Important RSI Reasons for BTC Crash:
Range Shift in RSI:- This is the initial hint to change the trend from bullish to bearish.
End of Overbought:- Slowly and gradually, RSI will end to make a new overbought.
Regular Bearish Divergence:- Finally, we have such a type of divergence to sit in Sell.
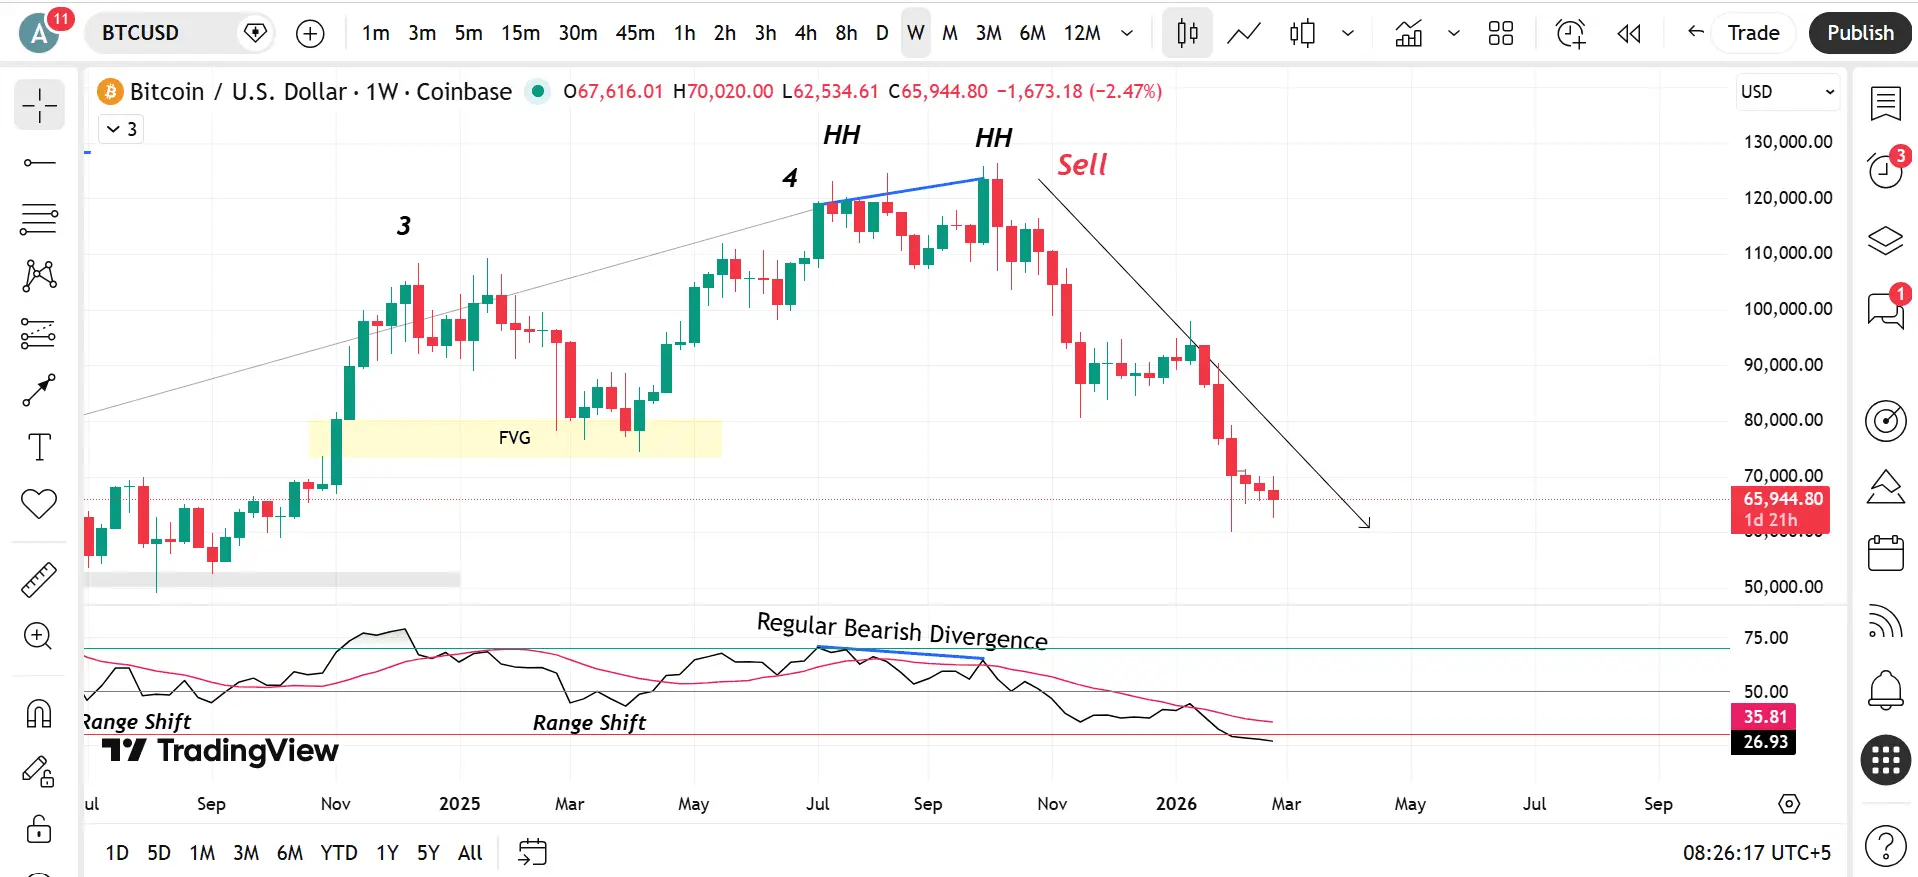
Look at the following picture, where I have drawn some lines, numbers, and hints in the price chart and RSI window.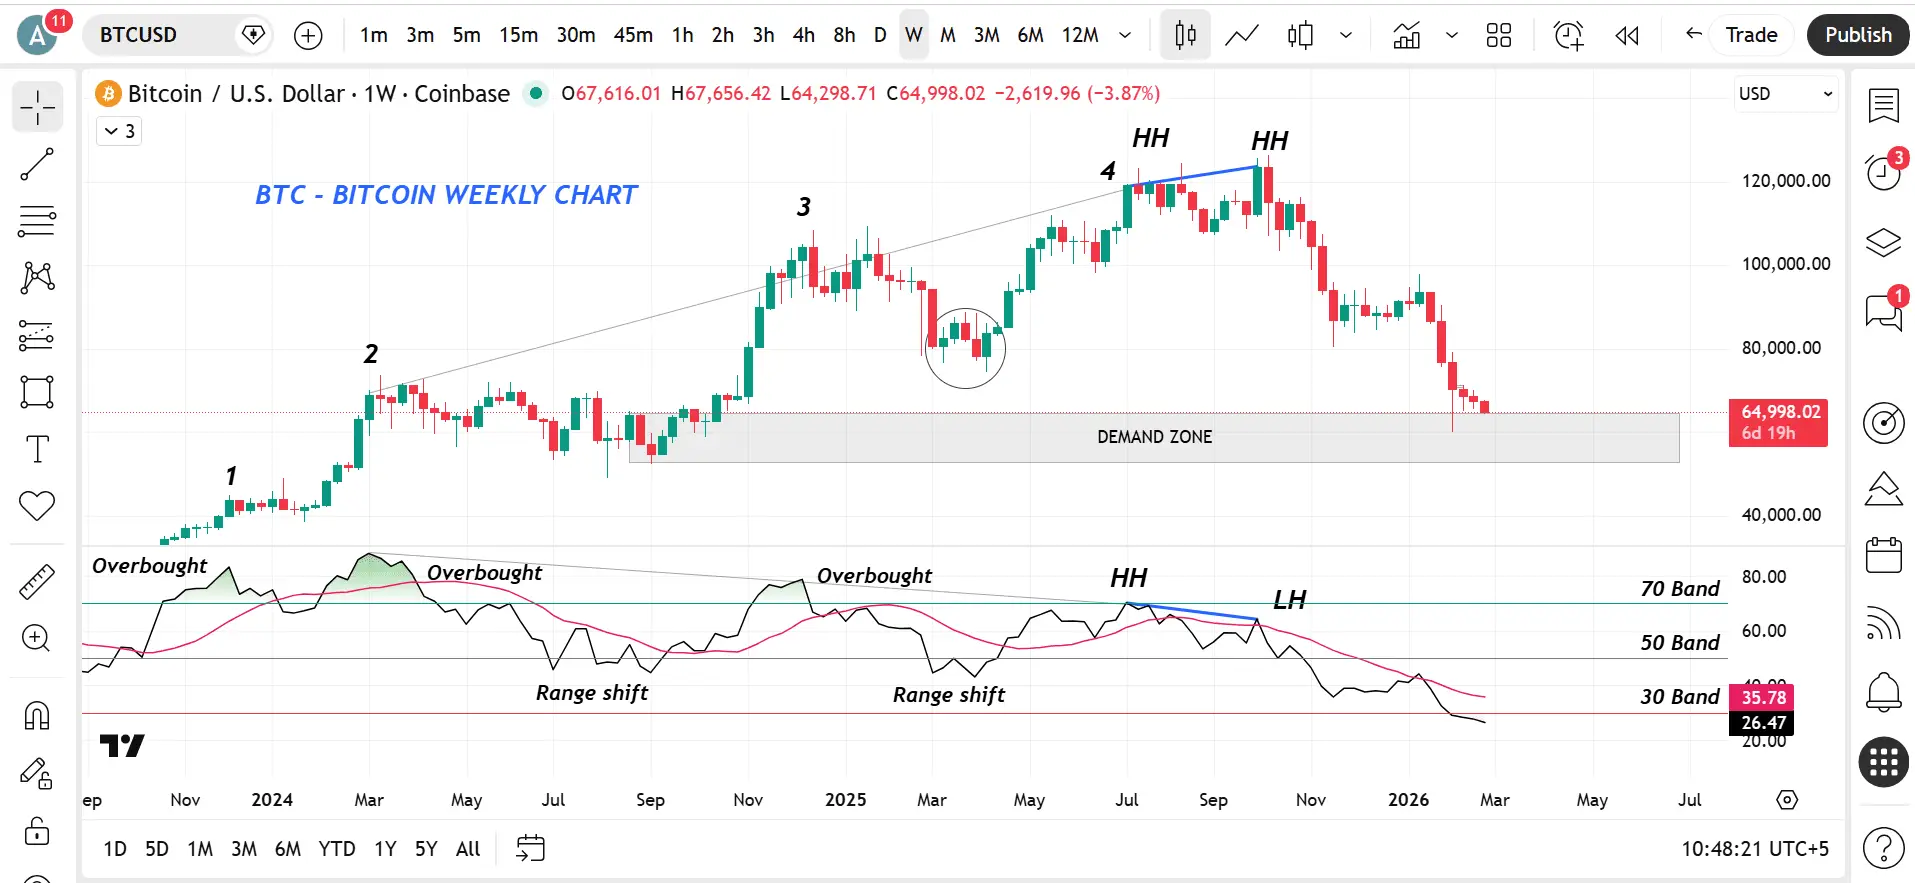
As you can see in the above picture, from the left side, the BTC – Bitcoin market was in a strong bullish trend.
You can observe in RSI that the price is traveling above the 70 Band, which is a sign of a strong bullish trend.
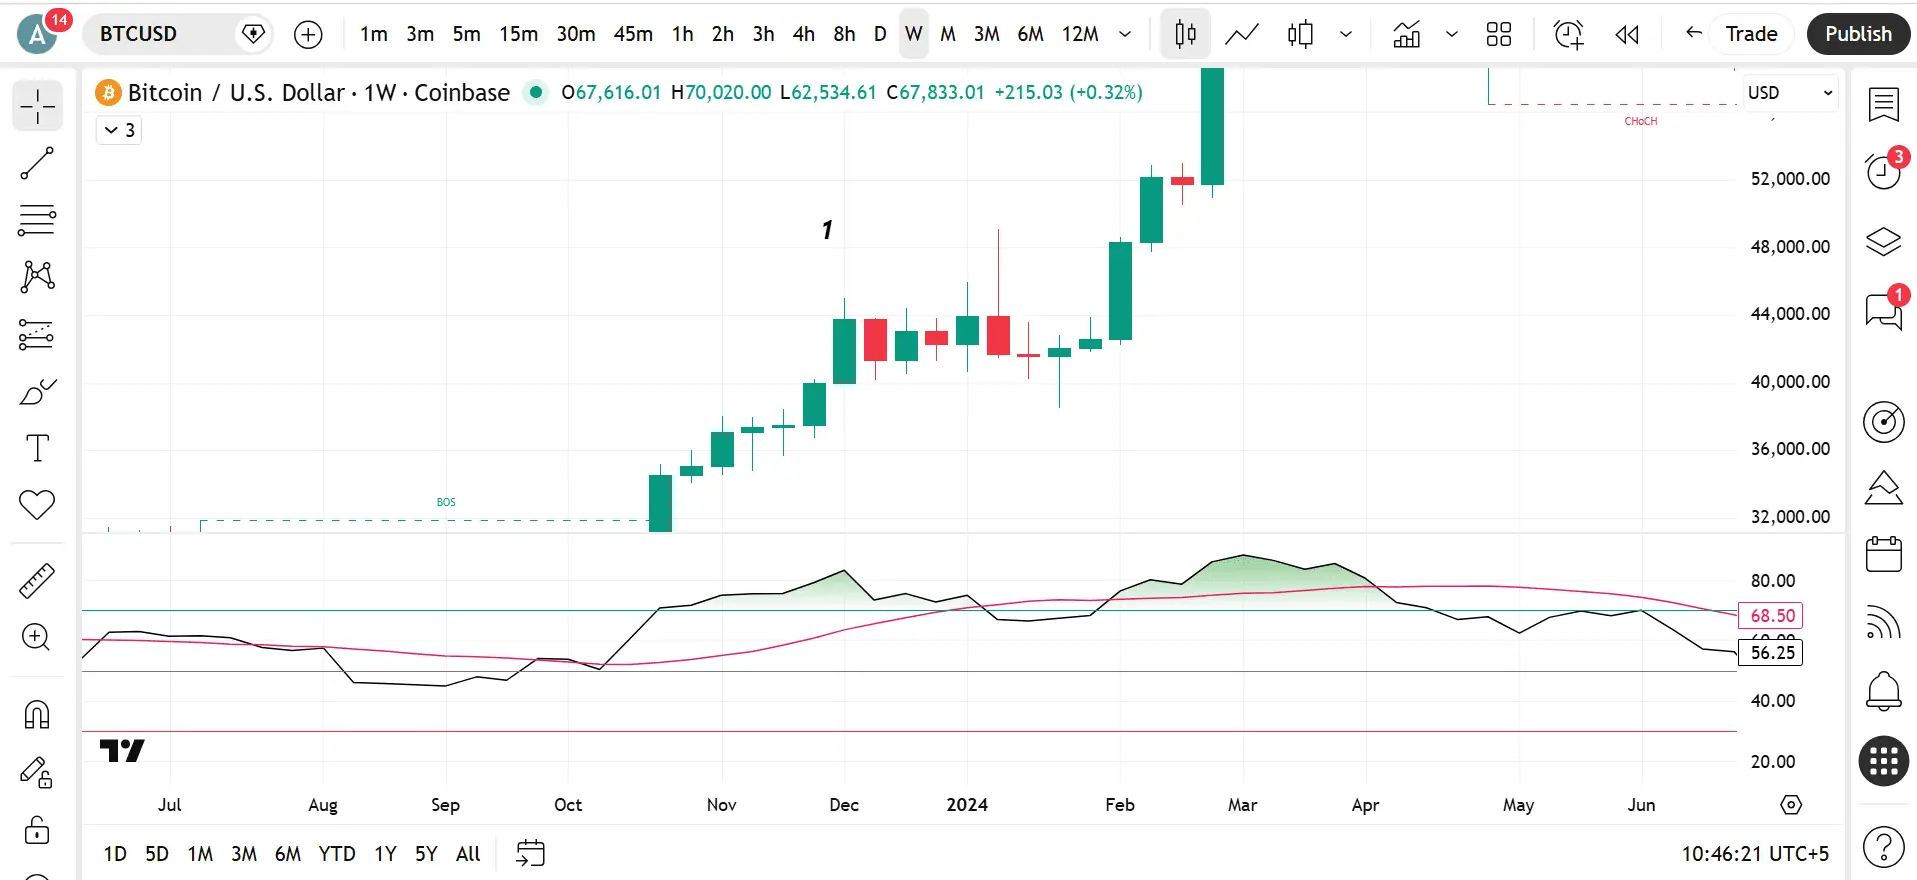
The market is creating higher highs and going to the upside. When Overbought was first created in the RSI window on the No. 1 location in the price chart.
When price created the No. 1 Overbought then market started a consolidation for 8 weeks continuously, then finally in the 9th week the range was broken, which made a strong bullish candle and continued the bullish trend.
See that particular area of the main picture, which I am sharing below:-
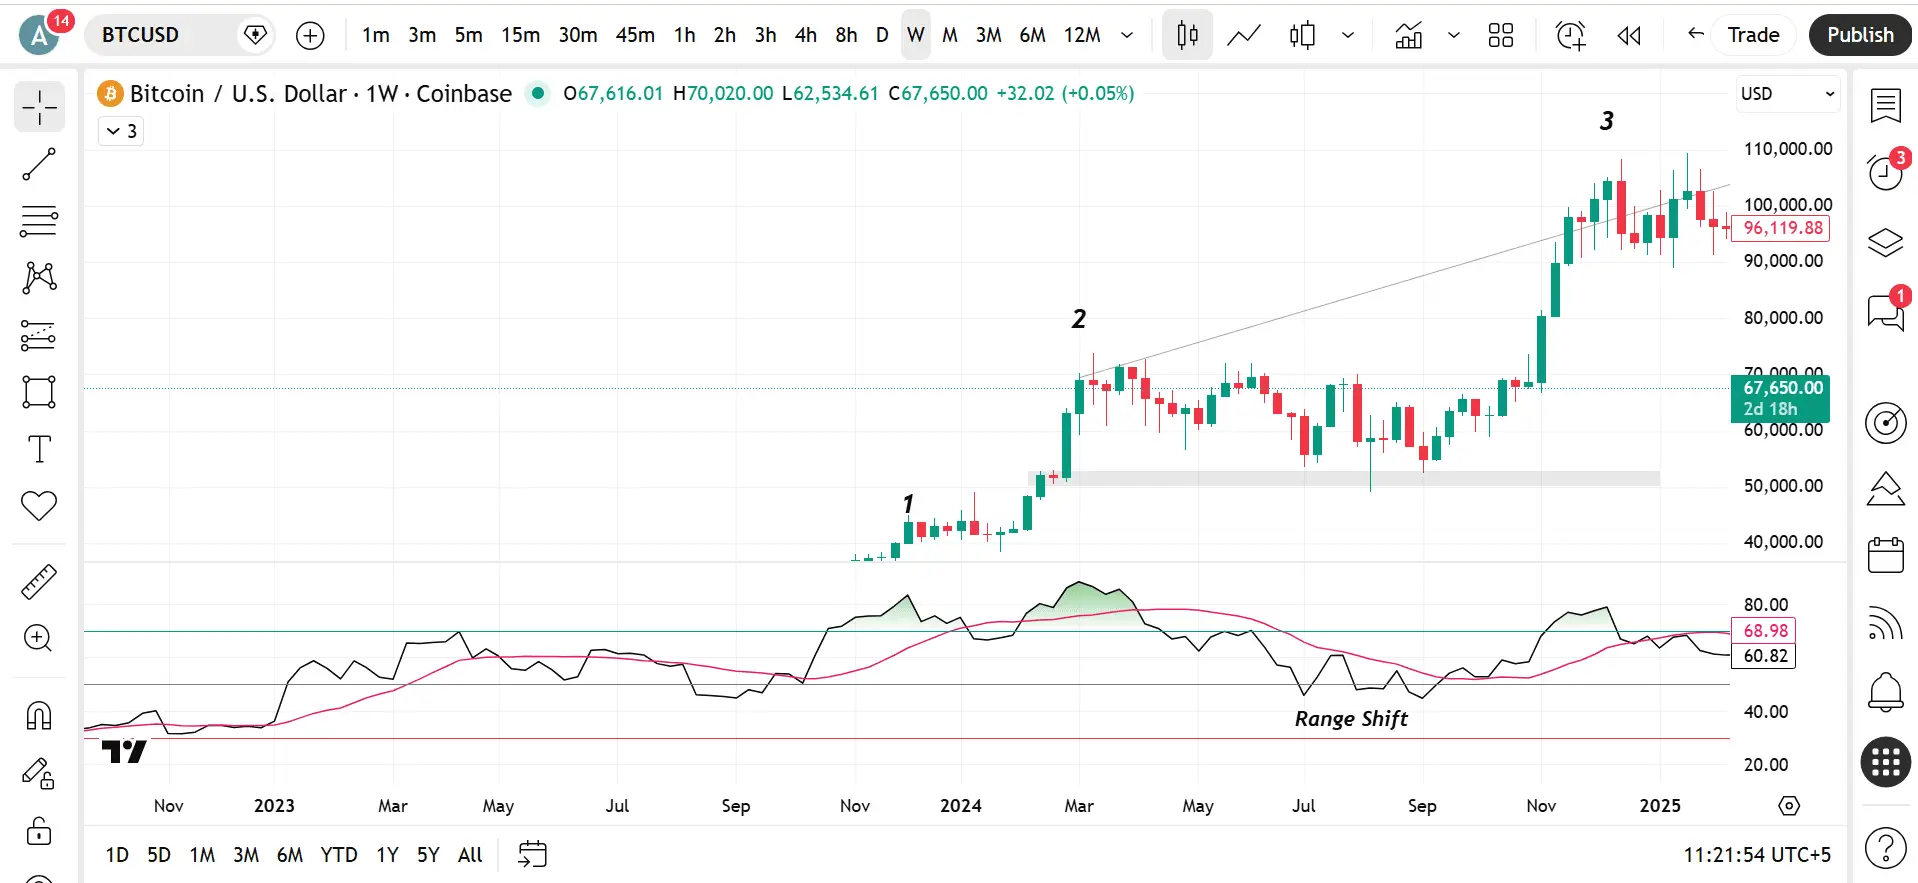
When the market moved to the upside and made a new higher high, then RSI created a 2nd Overbought see in the main picture at the exact location No. 2.
Then it started a correction, pullback, or retracement.
This correction, or we can say a range, was continued up to 33 weeks, then the market broke this consolidation and continued its strong bullish trend up to a new higher high till No. 3 in the main picture.
Tip: The entire range or correction was moving in a particular area, and there was a little order block or base area, which I have created in a gray color; the market could not break down that area and continued its bullish trend.
Here, in this situation, RSI has shifted its trading range to the sell side means below the 50 Band.
This is the first hint about the upcoming sell trend.
See the particular part of that situation from the main picture:-
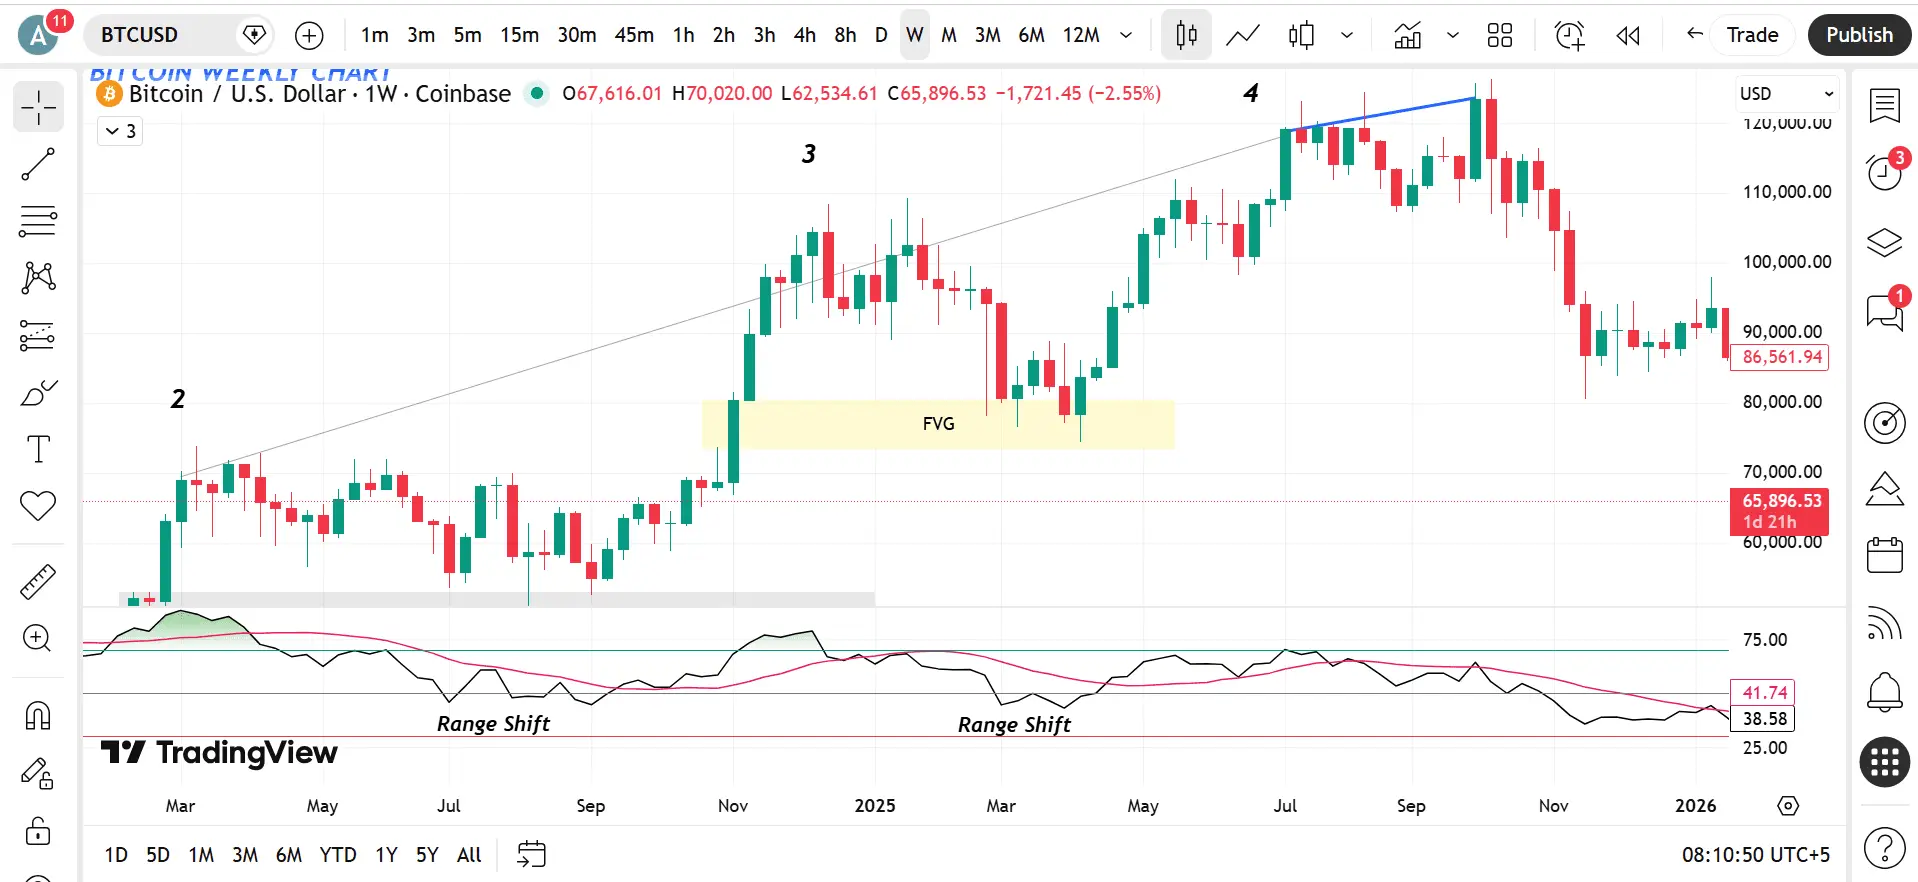
After that market continued making new higer high and reached the 3rd Overbought in the RSI and started its correction.
The market had left an FVG – Fair Value Gap while making that 3rd higher high, so the market had to fill that FVG.
The market came to fill that gap and made a double bottom in that fvg area, then moved up to a new higher high, till the No. 4.
This second time, the RSI has shifted its range below the 50 Band.
Check out the following picture for a clear understanding of what I wanted to tell:-
After reaching No.4th, the market took a short pullback/retracement and made a new higher high.
This is the final point, where the Sell trend is going to start, because RSI has created a Regular Bearish Divergence here.
The market created a new higher high, but RSI created a lower high. From this point, we had to plan the perfect sell entry and could take a huge profit.
The market has been in a down trend for 21 weeks continuously, and crashed by 62,703 dollars.
See the following picture for clarity:-
What is the current position of BTC – Bitcoin?
BTC has been in consolidation for the last 3 weeks, and this situation seems to continue for up coming weeks too.
Who could take advantage of this crash?
The traders who trade BTC – Bitcoin in the Forex platform using MT5, could sell it and make a 62,703 move.
Fore better understanding of this article, watch the following video:-
